Your ROAS looks great. Your conversion rate is up. Revenue is climbing.
So why is your bank account shrinking?
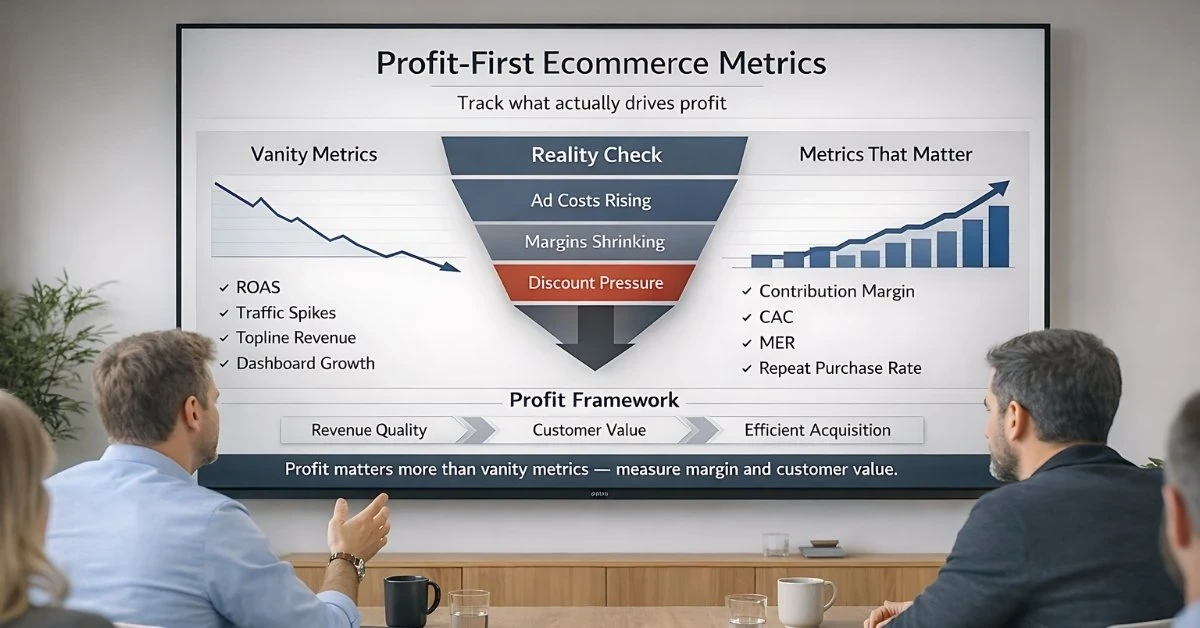
This is the metrics trap that kills ecommerce brands. They optimize for numbers that look good on a dashboard but don't translate to actual profit. They celebrate rising revenue while contribution margin collapses. They scale campaigns based on platform-reported ROAS that doesn't match reality.
The problem isn't that you're tracking metrics. It's that you're tracking the wrong ones — or tracking the right ones with broken data.
The Metrics Hierarchy: What Actually Drives Profit
Not all metrics are created equal. Some tell you if your business is healthy. Others are vanity metrics that feel good but don't predict profitability.
THE ECOMMERCE METRICS PYRAMID
════════════════════════════════════════════════════════════════════════════

                              ▲
                             ╱ ╲
                            ╱   ╲
                           ╱ L1  ╲         TRUTH METRICS
                          ╱ TRUTH ╲        ───────────────
                         ╱─────────╲       MER, Contribution Margin
                        ╱           ╲      Net Profit
                       ╱─────────────╲
                      ╱  L2           ╲    EFFICIENCY METRICS
                     ╱  EFFICIENCY     ╲   ────────────────────
                    ╱───────────────────╲  LTV:nCAC, Payback Period
                   ╱                     ╲
                  ╱  L3 DIAGNOSTIC        ╲ OPTIMIZATION LEVERS
                 ╱─────────────────────────╲ ────────────────────
                ╱                           ╲ CVR, AOV, ROAS
               ╱  L4 ACTIVITY                ╲
              ╱───────────────────────────────╲ TACTICAL SIGNALS
             ╱                                 ╲ ─────────────────
            ╱  Traffic, CTR, Impressions        ╲ Daily decisions
           ▔▔▔▔▔▔▔▔▔▔▔▔▔▔▔▔▔▔▔▔▔▔▔▔▔▔▔▔▔▔▔▔▔▔▔▔▔▔▔

    ▲ START HERE — If the top is broken, the bottom doesn't matter.

════════════════════════════════════════════════════════════════════════════
THE ECOMMERCE METRICS PYRAMID
════════════════════════════════════════════════════════════════════════════
▲
╱ ╲
╱ ╲
╱ L1 ╲ TRUTH METRICS
╱ TRUTH ╲ ───────────────
╱─────────╲ MER, Contribution Margin
╱ ╲ Net Profit
╱─────────────╲
╱ L2 ╲ EFFICIENCY METRICS
╱ EFFICIENCY ╲ ────────────────────
╱───────────────────╲ LTV:nCAC, Payback Period
╱ ╲
╱ L3 DIAGNOSTIC ╲ OPTIMIZATION LEVERS
╱─────────────────────────╲ ────────────────────
╱ ╲ CVR, AOV, ROAS
╱ L4 ACTIVITY ╲
╱───────────────────────────────╲ TACTICAL SIGNALS
╱ ╲ ─────────────────
╱ Traffic, CTR, Impressions ╲ Daily decisions
▔▔▔▔▔▔▔▔▔▔▔▔▔▔▔▔▔▔▔▔▔▔▔▔▔▔▔▔▔▔▔▔▔▔▔▔▔▔▔
▲ START HERE — If the top is broken, the bottom doesn't matter.
════════════════════════════════════════════════════════════════════════════THE ECOMMERCE METRICS PYRAMID
════════════════════════════════════════════════════════════════════════════
▲
╱ ╲
╱ ╲
╱ L1 ╲ TRUTH METRICS
╱ TRUTH ╲ ───────────────
╱─────────╲ MER, Contribution Margin
╱ ╲ Net Profit
╱─────────────╲
╱ L2 ╲ EFFICIENCY METRICS
╱ EFFICIENCY ╲ ────────────────────
╱───────────────────╲ LTV:nCAC, Payback Period
╱ ╲
╱ L3 DIAGNOSTIC ╲ OPTIMIZATION LEVERS
╱─────────────────────────╲ ────────────────────
╱ ╲ CVR, AOV, ROAS
╱ L4 ACTIVITY ╲
╱───────────────────────────────╲ TACTICAL SIGNALS
╱ ╲ ─────────────────
╱ Traffic, CTR, Impressions ╲ Daily decisions
▔▔▔▔▔▔▔▔▔▔▔▔▔▔▔▔▔▔▔▔▔▔▔▔▔▔▔▔▔▔▔▔▔▔▔▔▔▔▔
▲ START HERE — If the top is broken, the bottom doesn't matter.
════════════════════════════════════════════════════════════════════════════THE ECOMMERCE METRICS HIERARCHY (DETAILED)
════════════════════════════════════════════════════════════════════════════
LEVEL 1: TRUTH METRICS (Business health)
─────────────────────────────────────────
These determine if you're actually making money.
• Contribution Margin — Revenue minus all variable costs
• MER (Marketing Efficiency Ratio) — Total Revenue ÷ Total Ad Spend
• Net Profit — What's left after everything
LEVEL 2: EFFICIENCY METRICS (Unit economics)
─────────────────────────────────────────────
These determine if your model is sustainable.
• LTV:nCAC Ratio — Customer value vs. NEW <a href="https://pantosource.com/blog/customer-acquisition-cost" data-framer-link="Link:{"url":"https://pantosource.com/blog/customer-acquisition-cost","type":"url"}">customer acquisition cost</a>
• Blended nCAC — True cost to acquire a NEW customer
• Payback Period — Time to recover acquisition cost
⚠️ Use nCAC, not blended CAC. Mixing new and returning customers
hides poor acquisition performance behind strong retention.
LEVEL 3: DIAGNOSTIC METRICS (Optimization levers)
──────────────────────────────────────────────────
These help you find and fix problems.
• Conversion Rate — Visitors → Customers
• AOV — Average Order Value
• ROAS — Return on Ad Spend (by channel)
LEVEL 4: ACTIVITY METRICS (Tactical signals)
─────────────────────────────────────────────
These inform daily decisions but don't define success.
• Traffic — Visitors to your site
• CTR — Click-through rate on ads
• Impressions — How many saw your ads
════════════════════════════════════════════════════════════════════════════
Work from the top down. If Level 1 metrics are broken,
optimizing Level 3 and 4 won't save you.THE ECOMMERCE METRICS HIERARCHY (DETAILED)
════════════════════════════════════════════════════════════════════════════
LEVEL 1: TRUTH METRICS (Business health)
─────────────────────────────────────────
These determine if you're actually making money.
• Contribution Margin — Revenue minus all variable costs
• MER (Marketing Efficiency Ratio) — Total Revenue ÷ Total Ad Spend
• Net Profit — What's left after everything
LEVEL 2: EFFICIENCY METRICS (Unit economics)
─────────────────────────────────────────────
These determine if your model is sustainable.
• LTV:nCAC Ratio — Customer value vs. NEW <a href="https://pantosource.com/blog/customer-acquisition-cost" data-framer-link="Link:{"url":"https://pantosource.com/blog/customer-acquisition-cost","type":"url"}">customer acquisition cost</a>
• Blended nCAC — True cost to acquire a NEW customer
• Payback Period — Time to recover acquisition cost
⚠️ Use nCAC, not blended CAC. Mixing new and returning customers
hides poor acquisition performance behind strong retention.
LEVEL 3: DIAGNOSTIC METRICS (Optimization levers)
──────────────────────────────────────────────────
These help you find and fix problems.
• Conversion Rate — Visitors → Customers
• AOV — Average Order Value
• ROAS — Return on Ad Spend (by channel)
LEVEL 4: ACTIVITY METRICS (Tactical signals)
─────────────────────────────────────────────
These inform daily decisions but don't define success.
• Traffic — Visitors to your site
• CTR — Click-through rate on ads
• Impressions — How many saw your ads
════════════════════════════════════════════════════════════════════════════
Work from the top down. If Level 1 metrics are broken,
optimizing Level 3 and 4 won't save you.Most brands spend their time obsessing over Level 3 and 4 metrics while ignoring the truth metrics that actually determine whether the business survives.
The Truth Metrics: Your Business Health Check
Marketing Efficiency Ratio (MER)
MER is the metric that cuts through platform attribution chaos. It doesn't care which channel claims credit for a sale — it just measures whether your marketing is working overall.
MARKETING EFFICIENCY RATIO (MER)
════════════════════════════════════════════════════════════════════════════

                              Total Revenue
                    MER   =  ───────────────
                              Total Ad Spend


    Example:
    ────────
    Monthly revenue:     $200,000
    Total ad spend:      $50,000

                          $200,000
                    MER = ──────────  =  4.0
                          $50,000


    THE MER GAP VISUAL:
    ───────────────────

    Ad Spend        Revenue Generated
    ────────        ─────────────────
    [$50K]    →     [$200K═══════════════════════]

              ◄─────── The Gap = Your Efficiency ───────►

    Wider gap = more efficient marketing
    No gap = break-even (danger zone)

════════════════════════════════════════════════════════════════════════════

    BENCHMARK RANGES:
    ─────────────────
    Below 3.0       Danger zone — spending too much to acquire revenue
    3.0 - 4.0       Break-even territory (depends on margins)
    4.0 - 6.0       Healthy — room for profit after costs
    Above 6.0       Excellent — strong unit economics

    YOUR TARGET depends on your gross margin.
    Higher margin products can tolerate lower MER.

════════════════════════════════════════════════════════════════════════════
MARKETING EFFICIENCY RATIO (MER)
════════════════════════════════════════════════════════════════════════════
Total Revenue
MER = ───────────────
Total Ad Spend
Example:
────────
Monthly revenue: $200,000
Total ad spend: $50,000
$200,000
MER = ────────── = 4.0
$50,000
THE MER GAP VISUAL:
───────────────────
Ad Spend Revenue Generated
──────── ─────────────────
[$50K] → [$200K═══════════════════════]
◄─────── The Gap = Your Efficiency ───────►
Wider gap = more efficient marketing
No gap = break-even (danger zone)
════════════════════════════════════════════════════════════════════════════
BENCHMARK RANGES:
─────────────────
Below 3.0 Danger zone — spending too much to acquire revenue
3.0 - 4.0 Break-even territory (depends on margins)
4.0 - 6.0 Healthy — room for profit after costs
Above 6.0 Excellent — strong unit economics
YOUR TARGET depends on your gross margin.
Higher margin products can tolerate lower MER.
════════════════════════════════════════════════════════════════════════════MARKETING EFFICIENCY RATIO (MER)
════════════════════════════════════════════════════════════════════════════
Total Revenue
MER = ───────────────
Total Ad Spend
Example:
────────
Monthly revenue: $200,000
Total ad spend: $50,000
$200,000
MER = ────────── = 4.0
$50,000
THE MER GAP VISUAL:
───────────────────
Ad Spend Revenue Generated
──────── ─────────────────
[$50K] → [$200K═══════════════════════]
◄─────── The Gap = Your Efficiency ───────►
Wider gap = more efficient marketing
No gap = break-even (danger zone)
════════════════════════════════════════════════════════════════════════════
BENCHMARK RANGES:
─────────────────
Below 3.0 Danger zone — spending too much to acquire revenue
3.0 - 4.0 Break-even territory (depends on margins)
4.0 - 6.0 Healthy — room for profit after costs
Above 6.0 Excellent — strong unit economics
YOUR TARGET depends on your gross margin.
Higher margin products can tolerate lower MER.
════════════════════════════════════════════════════════════════════════════Why MER matters more than ROAS:
Platform ROAS (Meta, Google, TikTok) is self-reported and often inflated by 30-80% due to over-attribution. MER uses your actual revenue from Shopify and your actual ad spend — numbers that can't be gamed.
Watch MER weekly. If it drops while platform ROAS stays flat, your tracking is lying to you.
Contribution Margin
Revenue is vanity. Profit is sanity. Contribution margin tells you what's actually left after you pay for the product and getting it to the customer.
CONTRIBUTION MARGIN FORMULA
════════════════════════════════════════════════════════════════════════════

    CM  =  Revenue  −  (COGS + Shipping + Fees + Returns)

════════════════════════════════════════════════════════════════════════════
CONTRIBUTION MARGIN FORMULA
════════════════════════════════════════════════════════════════════════════
CM = Revenue − (COGS + Shipping + Fees + Returns)
════════════════════════════════════════════════════════════════════════════CONTRIBUTION MARGIN FORMULA
════════════════════════════════════════════════════════════════════════════
CM = Revenue − (COGS + Shipping + Fees + Returns)
════════════════════════════════════════════════════════════════════════════RETURN-AWARE CONTRIBUTION MARGIN
════════════════════════════════════════════════════════════════════════════
Variable Costs include:
• Cost of Goods Sold (COGS)
• Shipping costs (outbound + return shipping)
• Payment processing fees
• Platform transaction fees
• Returns and refunds ← THE HIDDEN KILLER
Example (Before Returns):
─────────────────────────
Revenue: $100
COGS: -$30
Shipping: -$8
Processing (3%): -$3
Platform fees: -$2
─────────────────────────────
Contribution Margin: $57 (57% margin)
Example (After 20% Return Rate):
─────────────────────────────────
Of every 10 orders, 2 come back.
Revenue retained: $80 (lost $20 to refunds)
COGS (8 units kept): -$24
Shipping (all 10): -$8 (you paid to ship returns too)
Return shipping: -$6 (cost to bring 2 back)
Processing: -$3 (some fees non-refundable)
Platform fees: -$2
Restocking/damage: -$4 (returned items often unsellable)
─────────────────────────────
TRUE Contribution: $33 (41% margin)
That's a 16-point margin collapse from returns alone.
════════════════════════════════════════════════════════════════════════════
THE 2026 RETURNS REALITY:
─────────────────────────
• Fashion/Apparel: 25-40% return rates
• Shoes: 30-35% return rates
• Electronics: 15-20% return rates
• Home goods: 10-15% return rates
In the "try-before-you-buy" economy, returns can eat
15-30% of revenue. A Return-Aware Contribution Margin
is the most honest metric an ecommerce brand can track.
════════════════════════════════════════════════════════════════════════════A brand with $1M in revenue and 30% contribution margin has $300K to cover ad spend and overhead. A brand with $1M in revenue and 60% contribution margin has $600K. Same revenue, completely different business.
The uncomfortable question: Do you know your return-adjusted contribution margin? Most brands don't — and they're making scaling decisions based on margins that don't exist.
The Efficiency Metrics: Is Your Model Sustainable?
LTV:CAC Ratio (Use nCAC, Not Blended CAC)
This is the fundamental equation of sustainable growth. How much is a customer worth over their lifetime compared to what you paid to acquire them?
Critical distinction: Use nCAC (New Customer Acquisition Cost), not blended CAC. If you include returning customers in your acquisition cost calculation, you're hiding poor acquisition performance behind strong retention.
LTV:nCAC RATIO
════════════════════════════════════════════════════════════════════════════

                              Customer Lifetime Value
    LTV:nCAC Ratio   =       ─────────────────────────
                              New Customer Acquisition Cost


    WHY nCAC, NOT CAC:
    ──────────────────

    BLENDED CAC (Misleading):
    Total ad spend ÷ Total customers (new + returning)

    $50,000 spend ÷ 1,000 customers = $50 CAC  ← Looks great!

    But wait... 400 of those were returning customers
    who would have bought anyway.


    nCAC (The Truth):
    Total acquisition spend ÷ New customers only

    $50,000 spend ÷ 600 new customers = $83 nCAC  ← Reality check.

════════════════════════════════════════════════════════════════════════════LTV:nCAC RATIO
════════════════════════════════════════════════════════════════════════════
Customer Lifetime Value
LTV:nCAC Ratio = ─────────────────────────
New Customer Acquisition Cost
WHY nCAC, NOT CAC:
──────────────────
BLENDED CAC (Misleading):
Total ad spend ÷ Total customers (new + returning)
$50,000 spend ÷ 1,000 customers = $50 CAC ← Looks great!
But wait... 400 of those were returning customers
who would have bought anyway.
nCAC (The Truth):
Total acquisition spend ÷ New customers only
$50,000 spend ÷ 600 new customers = $83 nCAC ← Reality check.
════════════════════════════════════════════════════════════════════════════SIMPLE LTV CALCULATION
════════════════════════════════════════════════════════════════════════════
LTV = AOV × Purchase Frequency × Customer Lifespan (years)
Example:
AOV = $80, Purchases per year = 2.5, Lifespan = 2 years
LTV = $80 × 2.5 × 2 = $400
════════════════════════════════════════════════════════════════════════════LTV:nCAC RATIO INTERPRETATION
════════════════════════════════════════════════════════════════════════════
CUSTOMER VALUE COHORTS:
┌─────────────────────────────────────────────────────────────────────┐
│ │
│ RATIO < 1:1 │ 1:1 - 2:1 │ 3:1+ │
│ ══════════ │ ════════ │ ════ │
│ │ │ │
│ ┌─────┐ │ ┌─────┐ │ ┌─────┐ │
│ │ LTV │ < nCAC │ │ LTV │ ≈ nCAC │ │ LTV │ >>> nCAC │
│ │$200 │ $300 │ │$200 │ $150 │ │$400 │ $100 │
│ └─────┘ │ └─────┘ │ └─────┘ │
│ │ │ │
│ LOSING MONEY │ BREAK-EVEN │ SCALABLE │
│ Every customer │ Risky — no │ Room to invest │
│ costs you profit │ margin for │ in growth │
│ │ error │ │
│ │ │ │
└─────────────────────────────────────────────────────────────────────┘
BENCHMARK:
──────────
Below 1:1 You're losing money on every customer
1:1 to 2:1 Break-even to marginal — risky
3:1 Industry standard for healthy businesses
Above 4:1 Excellent — or possibly under-investing in growth
════════════════════════════════════════════════════════════════════════════The 2026 caveat: Both LTV and nCAC calculations depend on accurate tracking. If your conversion data is 40-60% incomplete (which is common with pixel-only tracking), your nCAC looks artificially high and your LTV might be understated. Fix your data foundation before trusting these numbers.
Payback Period
How long does it take to recover your customer acquisition cost? This determines how fast you can reinvest in growth.
PAYBACK PERIOD
════════════════════════════════════════════════════════════════════════════

                                   CAC
    Payback Period (months) = ────────────────────
                               Monthly Revenue per Customer


    Example:
    ────────
    CAC = $60
    AOV = $80, Purchases per year = 2.5
    Monthly revenue per customer = ($80 × 2.5) ÷ 12 = $16.67

    Payback Period = $60 ÷ $16.67 = 3.6 months


    BENCHMARK RANGES:
    ─────────────────
    Under 3 months      Excellent — fast cash recovery
    3-6 months          Healthy for most DTC brands
    6-12 months         Acceptable if LTV is strong
    Over 12 months      Cash flow risk — requires capital

════════════════════════════════════════════════════════════════════════════
PAYBACK PERIOD
════════════════════════════════════════════════════════════════════════════
CAC
Payback Period (months) = ────────────────────
Monthly Revenue per Customer
Example:
────────
CAC = $60
AOV = $80, Purchases per year = 2.5
Monthly revenue per customer = ($80 × 2.5) ÷ 12 = $16.67
Payback Period = $60 ÷ $16.67 = 3.6 months
BENCHMARK RANGES:
─────────────────
Under 3 months Excellent — fast cash recovery
3-6 months Healthy for most DTC brands
6-12 months Acceptable if LTV is strong
Over 12 months Cash flow risk — requires capital
════════════════════════════════════════════════════════════════════════════PAYBACK PERIOD
════════════════════════════════════════════════════════════════════════════
CAC
Payback Period (months) = ────────────────────
Monthly Revenue per Customer
Example:
────────
CAC = $60
AOV = $80, Purchases per year = 2.5
Monthly revenue per customer = ($80 × 2.5) ÷ 12 = $16.67
Payback Period = $60 ÷ $16.67 = 3.6 months
BENCHMARK RANGES:
─────────────────
Under 3 months Excellent — fast cash recovery
3-6 months Healthy for most DTC brands
6-12 months Acceptable if LTV is strong
Over 12 months Cash flow risk — requires capital
════════════════════════════════════════════════════════════════════════════Payback period matters because cash is finite. A 12-month payback means you need capital to fund growth. A 3-month payback means the business can fund its own expansion.
The Diagnostic Metrics: Finding and Fixing Problems
These metrics don't define business health, but they help you diagnose where things are breaking.
Conversion Rate
What percentage of visitors become customers? This is the core efficiency metric for your website.
CONVERSION RATE BENCHMARKS (2026)
════════════════════════════════════════════════════════════════════════════

    INDUSTRY                    AVERAGE         TOP PERFORMERS
    ────────                    ───────         ──────────────

    Fashion & Apparel           1.5 - 2.5%      4.0%+
    Health & Beauty             2.5 - 3.5%      5.0%+
    Home & Garden               1.5 - 2.5%      3.5%+
    Electronics                 1.0 - 2.0%      3.0%+
    Food & Beverage             3.0 - 4.5%      6.0%+

    DEVICE BREAKDOWN:
    ─────────────────
    Desktop:    3.5 - 4.5%
    Tablet:     3.0 - 4.0%
    Mobile:     1.5 - 2.5%  ← Still lower despite mobile traffic majority

════════════════════════════════════════════════════════════════════════════
CONVERSION RATE BENCHMARKS (2026)
════════════════════════════════════════════════════════════════════════════
INDUSTRY AVERAGE TOP PERFORMERS
──────── ─────── ──────────────
Fashion & Apparel 1.5 - 2.5% 4.0%+
Health & Beauty 2.5 - 3.5% 5.0%+
Home & Garden 1.5 - 2.5% 3.5%+
Electronics 1.0 - 2.0% 3.0%+
Food & Beverage 3.0 - 4.5% 6.0%+
DEVICE BREAKDOWN:
─────────────────
Desktop: 3.5 - 4.5%
Tablet: 3.0 - 4.0%
Mobile: 1.5 - 2.5% ← Still lower despite mobile traffic majority
════════════════════════════════════════════════════════════════════════════CONVERSION RATE BENCHMARKS (2026)
════════════════════════════════════════════════════════════════════════════
INDUSTRY AVERAGE TOP PERFORMERS
──────── ─────── ──────────────
Fashion & Apparel 1.5 - 2.5% 4.0%+
Health & Beauty 2.5 - 3.5% 5.0%+
Home & Garden 1.5 - 2.5% 3.5%+
Electronics 1.0 - 2.0% 3.0%+
Food & Beverage 3.0 - 4.5% 6.0%+
DEVICE BREAKDOWN:
─────────────────
Desktop: 3.5 - 4.5%
Tablet: 3.0 - 4.0%
Mobile: 1.5 - 2.5% ← Still lower despite mobile traffic majority
════════════════════════════════════════════════════════════════════════════Where to look when conversion rate drops:
Traffic quality — Did you change ad targeting or launch a new channel?
Site speed — Did page load time increase?
Pricing/offers — Did competitors change their positioning?
Funnel friction — Check add-to-cart rate and checkout completion separately
Average Order Value (AOV)
How much does each customer spend per transaction? AOV is one of the fastest levers to improve profitability without increasing traffic or conversion rate.
AVERAGE ORDER VALUE IMPACT
════════════════════════════════════════════════════════════════════════════

    SCENARIO: 10,000 monthly visitors, 2.5% conversion rate

    CURRENT STATE:
    AOV = $75
    Monthly revenue = 10,000 × 2.5% × $75 = $18,750

    WITH 20% AOV INCREASE:
    AOV = $90
    Monthly revenue = 10,000 × 2.5% × $90 = $22,500

    ADDITIONAL REVENUE: $3,750/month ($45,000/year)

    No additional traffic. No additional ad spend.
    Pure profit improvement.

════════════════════════════════════════════════════════════════════════════
AVERAGE ORDER VALUE IMPACT
════════════════════════════════════════════════════════════════════════════
SCENARIO: 10,000 monthly visitors, 2.5% conversion rate
CURRENT STATE:
AOV = $75
Monthly revenue = 10,000 × 2.5% × $75 = $18,750
WITH 20% AOV INCREASE:
AOV = $90
Monthly revenue = 10,000 × 2.5% × $90 = $22,500
ADDITIONAL REVENUE: $3,750/month ($45,000/year)
No additional traffic. No additional ad spend.
Pure profit improvement.
════════════════════════════════════════════════════════════════════════════AVERAGE ORDER VALUE IMPACT
════════════════════════════════════════════════════════════════════════════
SCENARIO: 10,000 monthly visitors, 2.5% conversion rate
CURRENT STATE:
AOV = $75
Monthly revenue = 10,000 × 2.5% × $75 = $18,750
WITH 20% AOV INCREASE:
AOV = $90
Monthly revenue = 10,000 × 2.5% × $90 = $22,500
ADDITIONAL REVENUE: $3,750/month ($45,000/year)
No additional traffic. No additional ad spend.
Pure profit improvement.
════════════════════════════════════════════════════════════════════════════AOV optimization tactics:
Bundles — Package complementary products at a slight discount
Free shipping thresholds — Set the threshold 20-30% above current AOV
Upsells at checkout — Offer a relevant add-on before payment
Tiered pricing — Incentivize larger quantities
Gift with purchase — Add a low-cost item at higher cart values
A 15% AOV increase with the same traffic and conversion rate = 15% more revenue at no additional acquisition cost. This is why AOV optimization often delivers faster ROI than conversion rate optimization. For the deeper playbook, see the average order value breakdown.
The Measurement Problem: Why Your Metrics Might Be Wrong
Here's the uncomfortable truth: in 2026, most ecommerce brands are making decisions based on metrics that are 40-60% incomplete.
Privacy changes have broken the tracking infrastructure that metrics depend on. iOS opt-outs, ad blockers, and browser restrictions mean your pixel-based data is a sample, not the full picture.
HOW SIGNAL LOSS DISTORTS YOUR METRICS
════════════════════════════════════════════════════════════════════════════

    METRIC              WHAT TRACKING SHOWS    WHAT'S ACTUALLY HAPPENING
    ──────              ───────────────────    ─────────────────────────

    Conversions         60 purchases           100 purchases (40% invisible)

    CAC                 $83/customer           $50/customer (inflated by
                                               undercounted conversions)

    ROAS                2.5x                   4.2x (same revenue, but
                                               more conversions actually
                                               came from ads)

    Conversion Rate     1.8%                   2.9% (traffic accurate,
                                               conversions undercounted)

════════════════════════════════════════════════════════════════════════════

When 40% of conversions are invisible, every metric downstream is wrong
What to do about it:
Use MER as your truth metric — It bypasses attribution entirely
Implement server-side tracking — captures conversions pixels miss. To see pricing options for this setup — covering the infrastructure that closes the 40-60% signal gap — see the breakdown.
Reconcile weekly — Compare platform data to backend sales
Accept directional accuracy — Focus on trends, not absolute numbers
Building Your Metrics Dashboard
Don't track everything. Track what matters for your stage of growth. For the deeper playbook on using ecommerce analytics properly — including the weekly review routine and decision frameworks — that guide takes the metrics defined here and shows how to act on them.
METRICS BY BUSINESS STAGE
════════════════════════════════════════════════════════════════════════════

    STAGE: VALIDATION ($0-$500K revenue)
    ────────────────────────────────────
    Focus: "Is this business viable?"

    Priority metrics:
    • Contribution Margin — Do we make money per order?
    • Conversion Rate — Does the site work?
    • CAC — Can we acquire customers affordably?


    STAGE: GROWTH ($500K-$5M revenue)
    ─────────────────────────────────
    Focus: "Can we scale profitably?"

    Priority metrics:
    • MER — Is marketing efficient overall?
    • LTV:CAC Ratio — Are customers worth the cost?
    • Payback Period — How fast can we reinvest?


    STAGE: SCALE ($5M+ revenue)
    ───────────────────────────
    Focus: "Can we optimize unit economics?"

    Priority metrics:
    • Contribution Margin by channel/product
    • New vs. Returning customer metrics
    • Cohort analysis — Which acquisition sources drive best LTV?

════════════════════════════════════════════════════════════════════════════
METRICS BY BUSINESS STAGE
════════════════════════════════════════════════════════════════════════════
STAGE: VALIDATION ($0-$500K revenue)
────────────────────────────────────
Focus: "Is this business viable?"
Priority metrics:
• Contribution Margin — Do we make money per order?
• Conversion Rate — Does the site work?
• CAC — Can we acquire customers affordably?
STAGE: GROWTH ($500K-$5M revenue)
─────────────────────────────────
Focus: "Can we scale profitably?"
Priority metrics:
• MER — Is marketing efficient overall?
• LTV:CAC Ratio — Are customers worth the cost?
• Payback Period — How fast can we reinvest?
STAGE: SCALE ($5M+ revenue)
───────────────────────────
Focus: "Can we optimize unit economics?"
Priority metrics:
• Contribution Margin by channel/product
• New vs. Returning customer metrics
• Cohort analysis — Which acquisition sources drive best LTV?
════════════════════════════════════════════════════════════════════════════METRICS BY BUSINESS STAGE
════════════════════════════════════════════════════════════════════════════
STAGE: VALIDATION ($0-$500K revenue)
────────────────────────────────────
Focus: "Is this business viable?"
Priority metrics:
• Contribution Margin — Do we make money per order?
• Conversion Rate — Does the site work?
• CAC — Can we acquire customers affordably?
STAGE: GROWTH ($500K-$5M revenue)
─────────────────────────────────
Focus: "Can we scale profitably?"
Priority metrics:
• MER — Is marketing efficient overall?
• LTV:CAC Ratio — Are customers worth the cost?
• Payback Period — How fast can we reinvest?
STAGE: SCALE ($5M+ revenue)
───────────────────────────
Focus: "Can we optimize unit economics?"
Priority metrics:
• Contribution Margin by channel/product
• New vs. Returning customer metrics
• Cohort analysis — Which acquisition sources drive best LTV?
════════════════════════════════════════════════════════════════════════════The Bottom Line
The brands that win in ecommerce aren't the ones tracking the most metrics. They're the ones tracking the right metrics — and making sure those metrics reflect reality.
Start with truth metrics: MER and Contribution Margin. These tell you if the business is actually profitable, regardless of what your ad platforms claim. If these numbers are red, no amount of optimization at the campaign level will save you.
Then build out efficiency metrics: LTV:CAC and Payback Period. These tell you if your model is sustainable and how fast you can grow. A 3:1 LTV:CAC ratio with a 6-month payback is a business that can scale. A 1.5:1 ratio with a 14-month payback needs fixing before you pour money into ads.
Use diagnostic metrics — Conversion Rate, AOV, ROAS — to find and fix problems. But don't mistake them for success metrics. A great conversion rate means nothing if your contribution margin is negative. A high ROAS by channel means nothing if your MER is declining.
And before you trust any number, fix your tracking. In 2026, incomplete data isn't a minor inconvenience — it's a strategic liability that leads to wrong decisions at scale. Every metric in your dashboard is only as accurate as the data feeding it.
Your dashboard is only as good as the data feeding it. Make sure you're measuring what actually matters — and that you can trust what you're measuring. For how these metrics feed into the broader ecommerce growth fundamentals playbook — across acquisition, conversion, and retention — that guide ties measurement to action.